
Chart and stats visuals
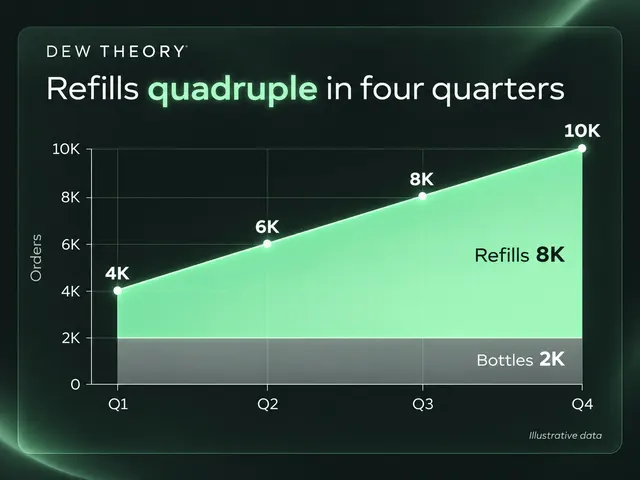
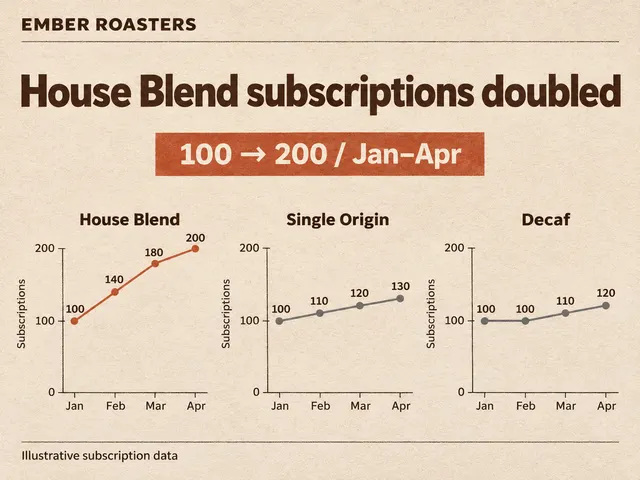
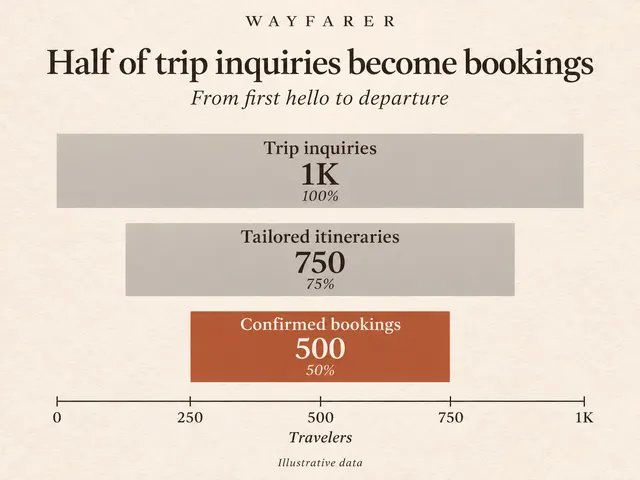
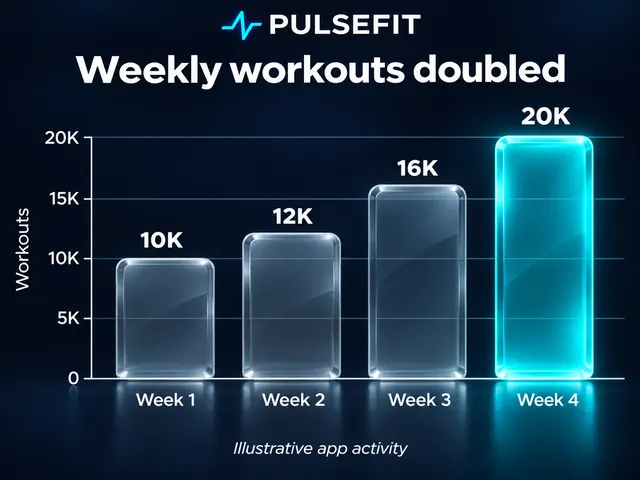
Numbers look like results when they have a chart behind them. Glass bar, line, donut and gauge charts for stats sections and results pages.
13 charts, all different
 More like this
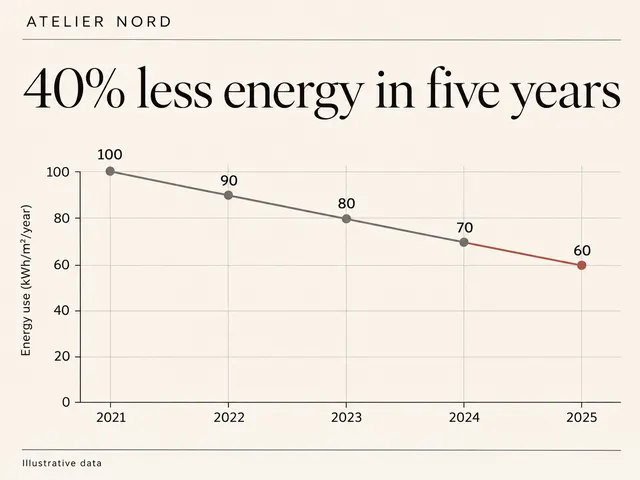
Less Energy, Better BuildingsCharts
 More like this
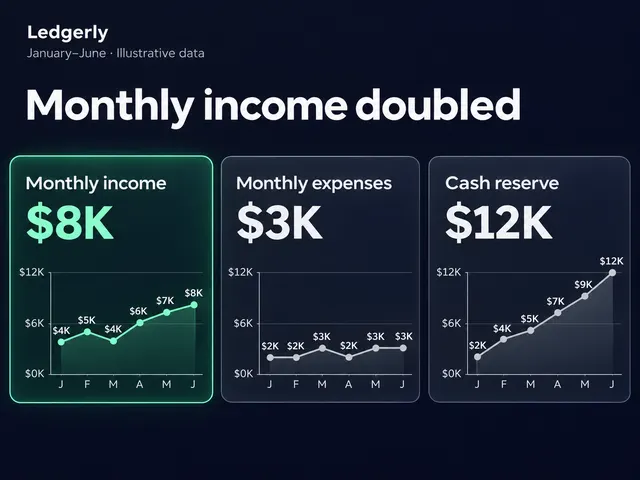
Freelancer Income GrowthCharts
 More like this
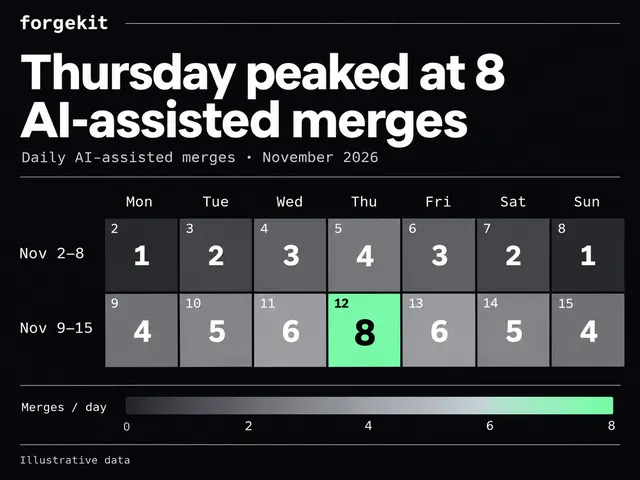
Peak Merge CalendarCharts
 More like this
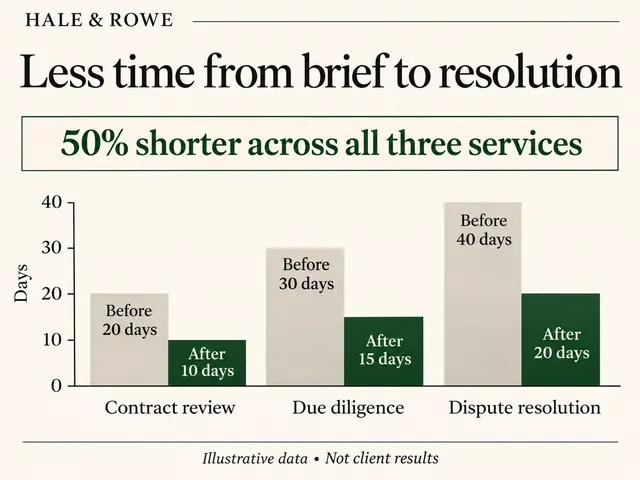
Faster Legal ResolutionCharts
 More like this
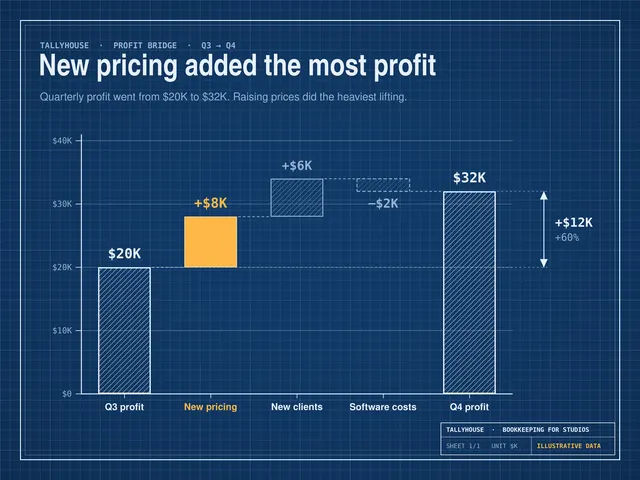
Pricing Profit BridgeCharts
More like thisLess Energy, Better BuildingsCharts
 More like this
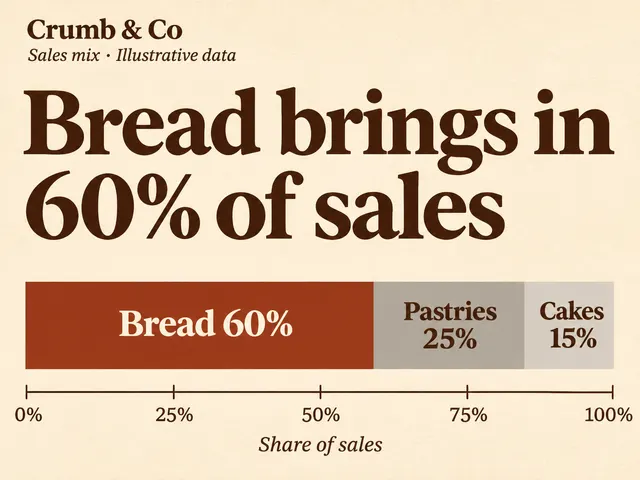
Bread Sales ShareCharts
 More like this
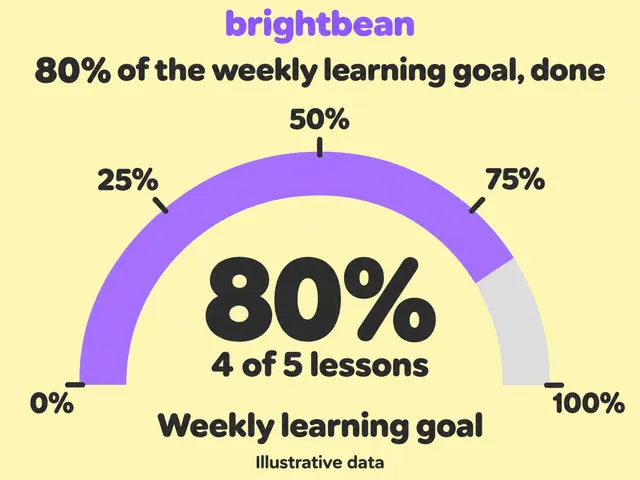
Weekly Learning GaugeCharts
More like thisPricing Profit BridgeCharts
 More like this
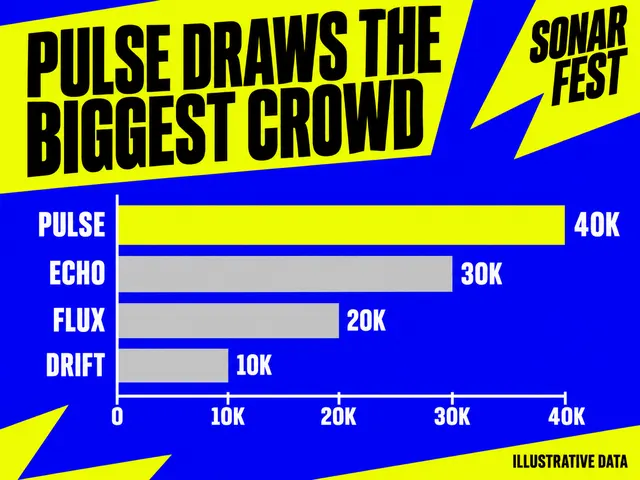
Pulse Leads AttendanceCharts
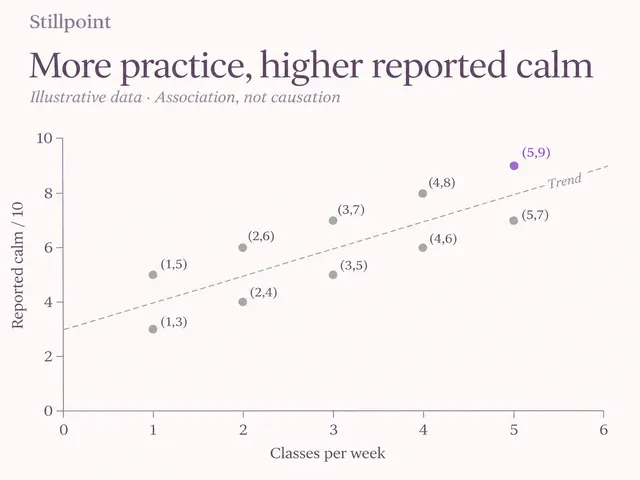 More like this
Practice And CalmCharts
More like thisFaster Legal ResolutionCharts